iCADdocs_online
Cloud Data and Contours
iCAD presents an easy to use module to process point cloud data from surveying, drone data or other sources, and creating contour plots. It includes powerful analysis tools for creating a surface mesh, data grids and outlier analysis.
To start using the ContourCloud module, one must have the point cloud data hosted on to an AutoCAD object. Refer to Data Processing & Presentation under the section Hosting Data to AutoCAD Object.
Table of Contents
- Defiing Boundaries
- Creating Regions of Interest (RoIs)
- Point cloud processing
- Generated AutoCAD Plots
Defiing Boundaries
Befor continuing make sure the cloud data is hosted on to an AutoCAD object, and your current iCAD session is linked to the AutoCAD file containing the object.
:bulb: Note: It is always recommended to use standard host objects found in iCAD’s latest release library. Avoid using arbitrary objects, especially when the work will persist, and may be shared with others.
-
Invoke the New Session process from
Session > Creare and Run New Session...menu command. Alternatively, you can start it from the Workspace Manager by clicking on the toolbar button as shown.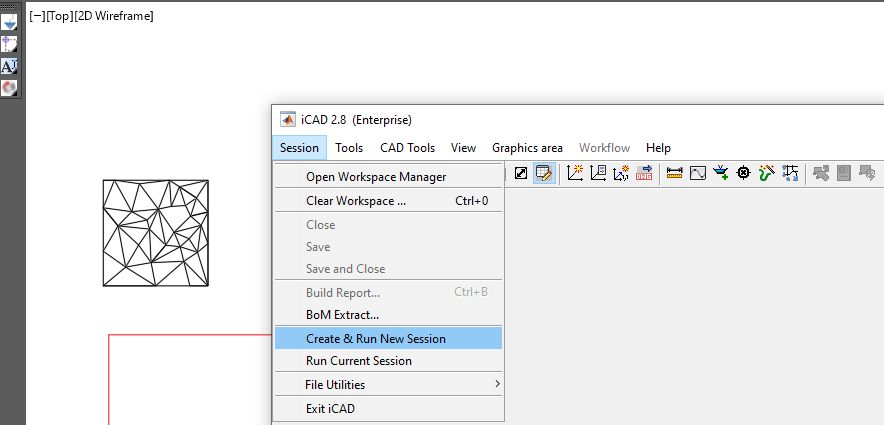
Figure: starting session browser from menu command.
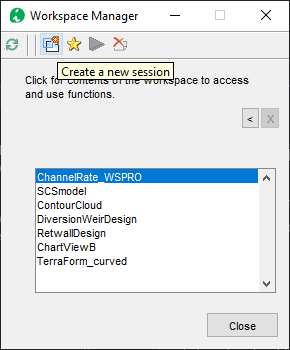
Figure: starting session browser from the Workspace manager interface.
-
In the Module Browser dialog, select ContourCloud module, and hit
Continue.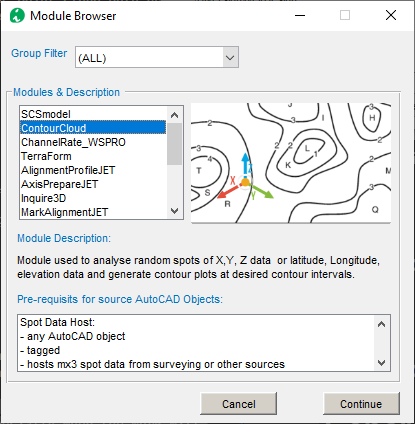
-
Provide a name for the session, and hit
Ok.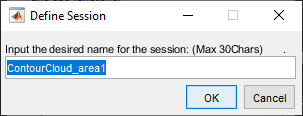
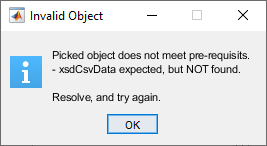
-
In the New Session dialog, click on the Spot Data Host list item. AutoCAD will be in select mode. Go and pick the host object refering to the cloud data for processing.
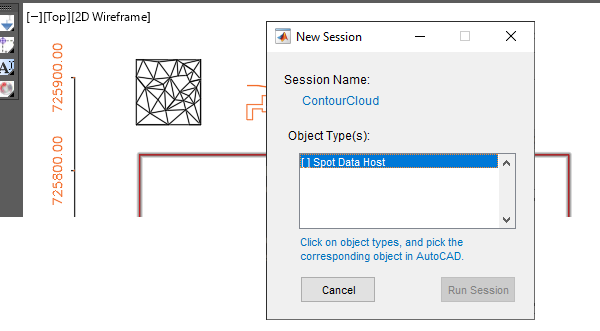
:bulb: Tip The process will validate the object for expected data, and may throw an error message. Resolve the issue and try again, if this happens.
Upon succesful selection, and acceptance of the selected object, the list item will be checked, and the run button activated. Hit
Run Sessionto continue.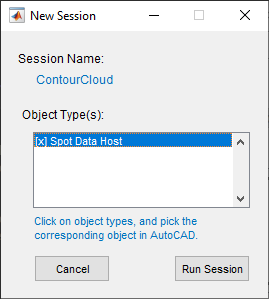
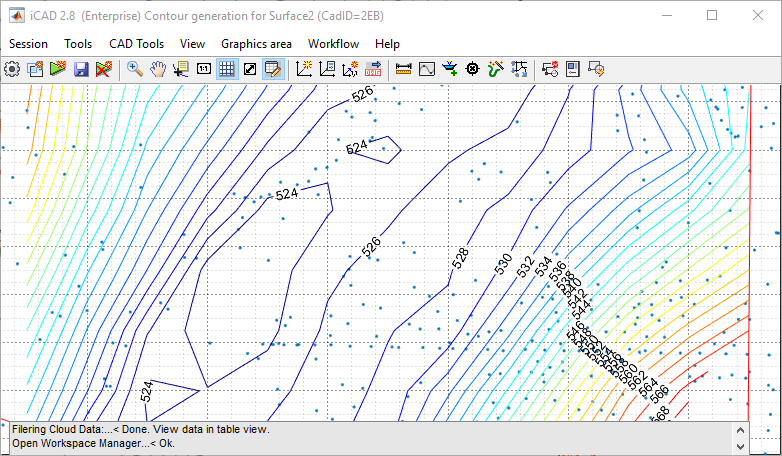
This will start the module with the cloud data plotted on the main interface. Use the functions available under the Workflow Menu to process, present and export results.
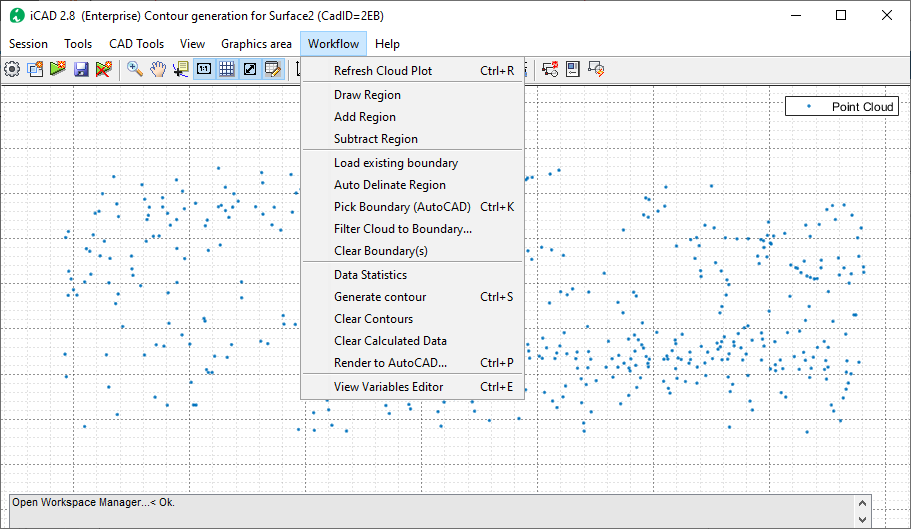
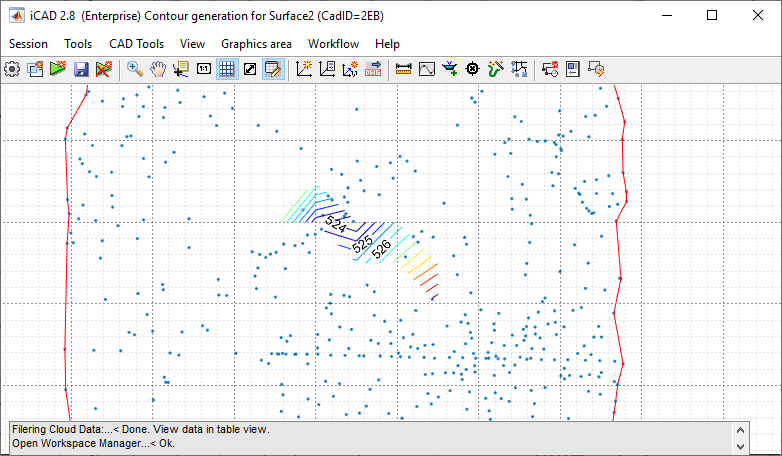
Creating Regions of Interest (RoIs)
A boundary information is required to execute any point cloud processing. The boundary area can be created in different ways.
Automatic Boudndary creaion
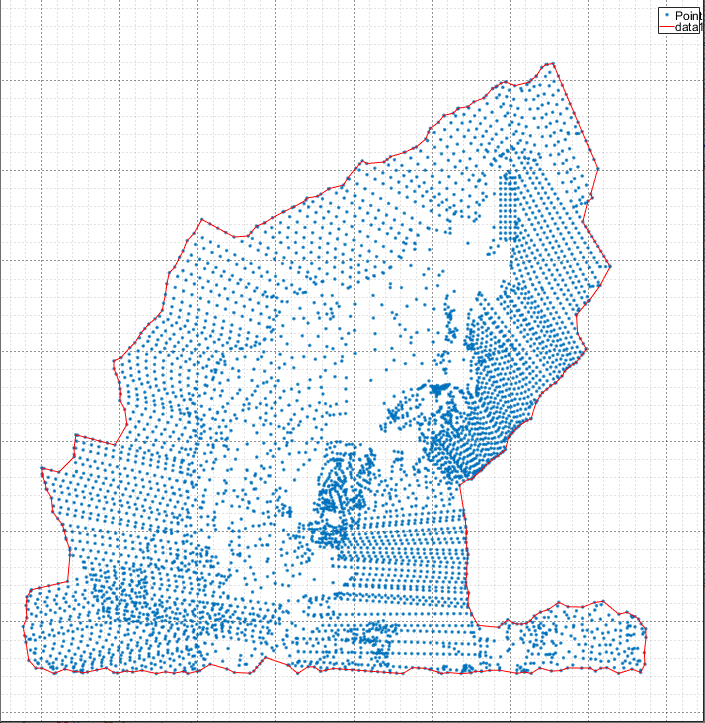
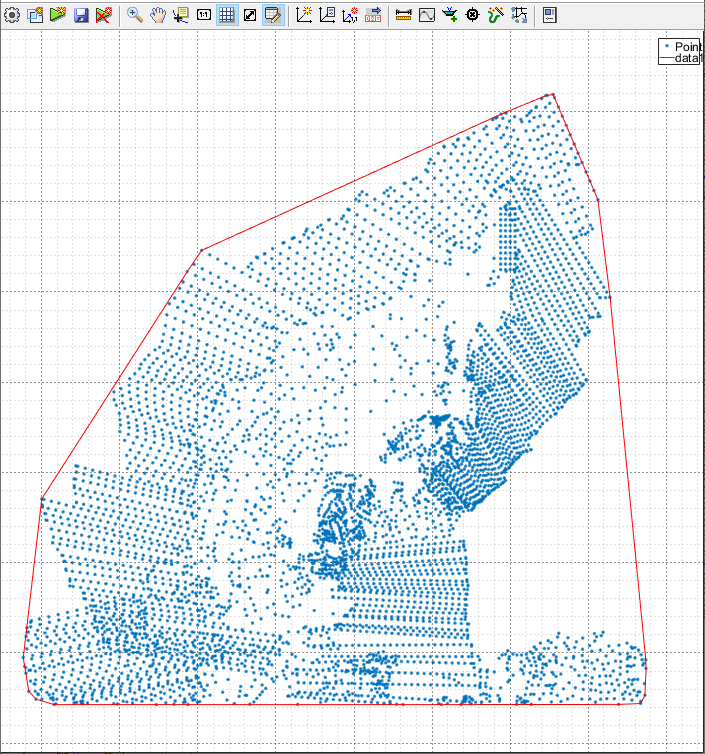
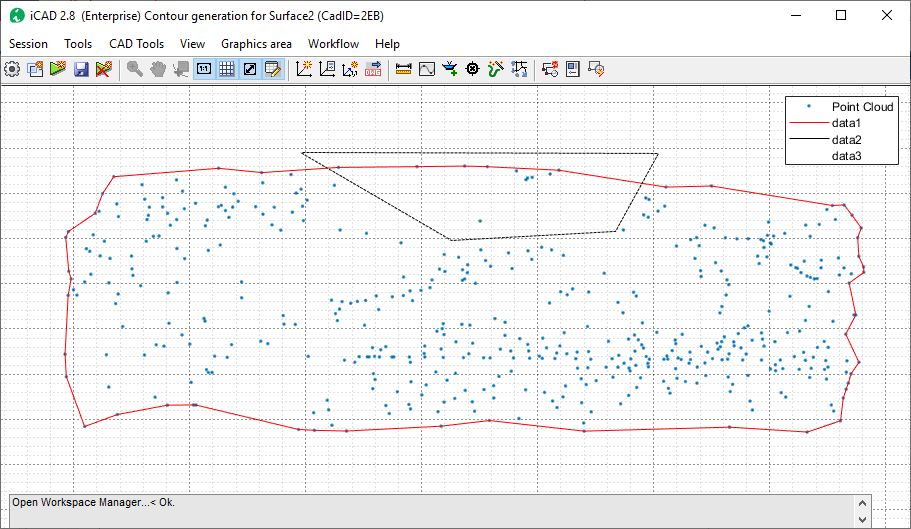
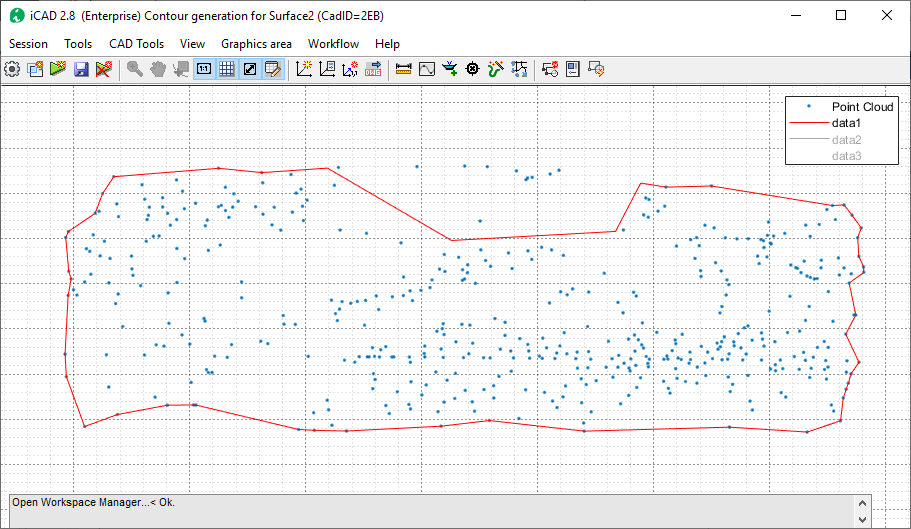
Use Workflow > Auto Delineate Region to create a boundary area around the data point automatically.
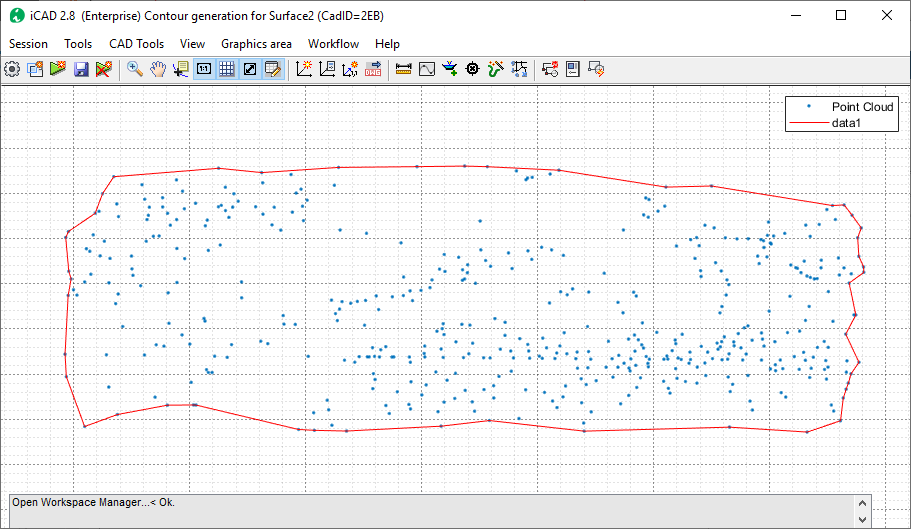
The generated boundary can be made more tight or loose around the point cloud data using the shrink factor variable.
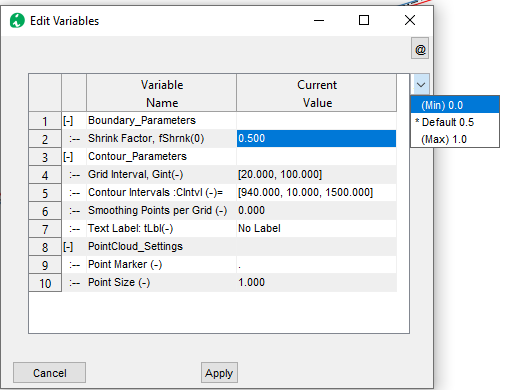
Choose a value close to 1, to make the boundary more tight around the points as shown below.
Choose a value close to 0 for a more loose boundary.
Manuall Boundary creation or Edit
One can also manually create new boundary data from Workflow > Draw Region menu command,
Any boundary area created, can be edited by using Workflow > Add Region and Workflow > Subtract Region menu commands.
When starting all the manual commands (creating, adding and subtracting) follow these steps.
- Select the desired points interactively by using
Left Mouse Click. - Use
BackSpacekey to delete the previously inserted point, and resume insertion. - Use
Shift+Left ClickorRight Clickto insert the finalpoint. This will end the selection mode. - Use
Enterkey to end point insertion process.
Upon completion, the new area is added or subtracted, depending on the menu command used to invoke the process.
:bulb: Tip: Boundary data area saved along with any other relevant data with the session. Hit
Saveto save the data.
Previously defined and saved boundary data can be inserted using Workflow > Load Existing Boundary menu command.
Import from AutoCAD
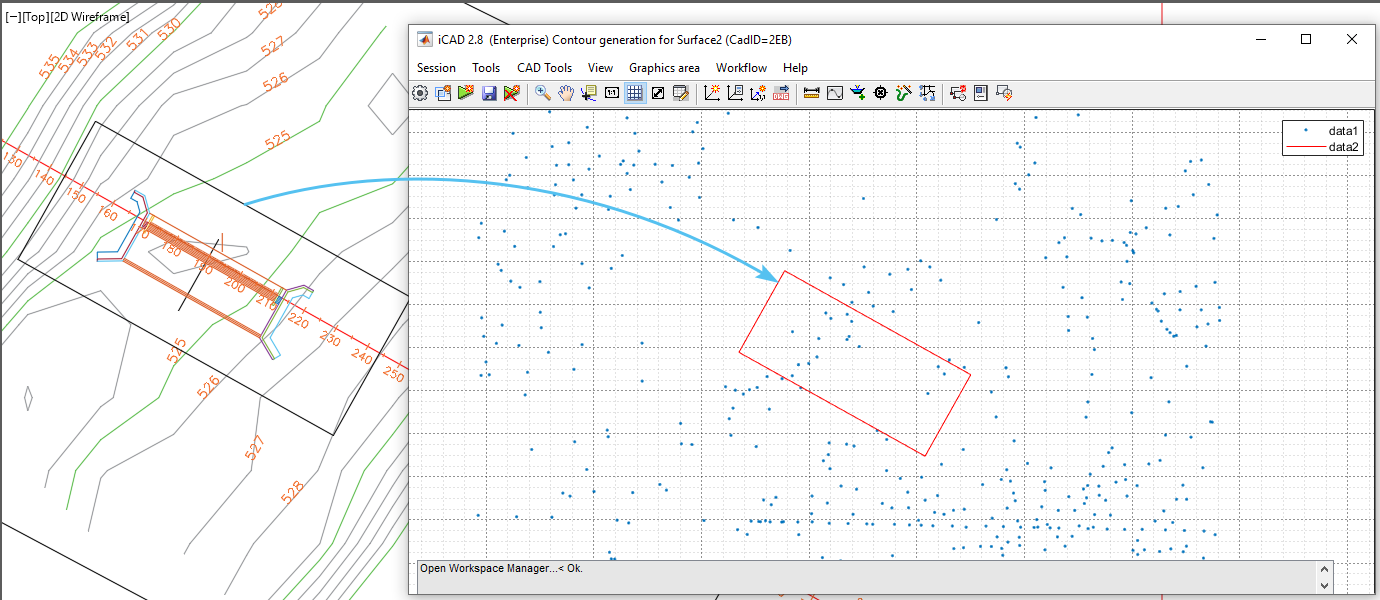
If an RoI is defined in AutoCAD environment, this can be imported using the Workflow > Pick from AutoCAD menu command.
Point cloud processing
Once the boundary data is established different operations can be done on the cloud data set, as described below.
Filetering Data to RoIs
Filtering data can be very helpful, especially when dealing with a large point cloud data set. The Workflow > Filter Cloud to Boundary tool alows to id and filter all data points in or on the boundary area defined.
The resuls are displayed on the Data Table interface, as noted on the statu bar.
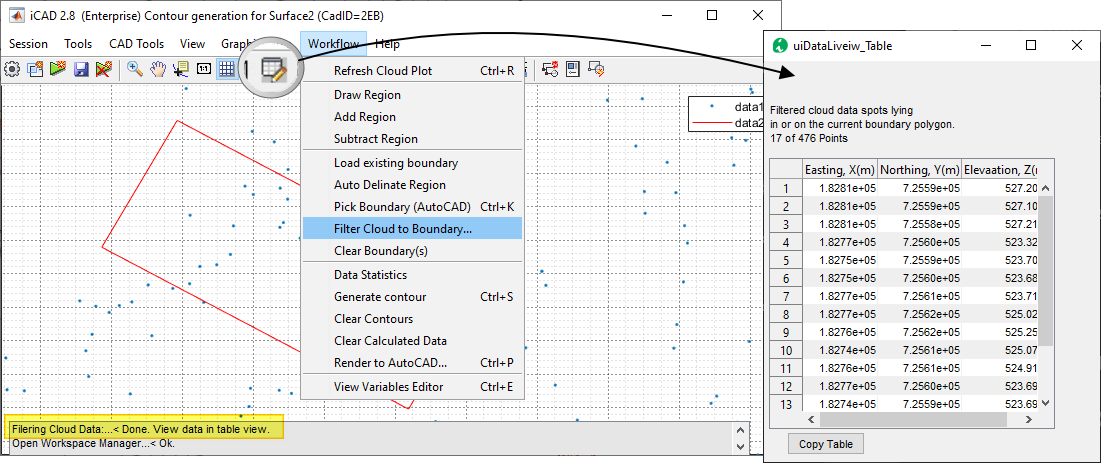
The filtered data set can be copied for further processing with spreadsheet applications.
:bulb: Tip: The copid data can be hosted on to any AutoCAD object directly from
Tools > Paste CSV data.
Identifying Outliers
Statistical analysis can help deal with identifiying and dealing with Outlier data. Rarely, this can be an issue engineers enconter when dealing with raw surveyng data or from other sources.
Identifying outliers can be achieved from Workflow > Data Statistics menu command. The process will display the result using a box chart, a standard statistical visualization tool.
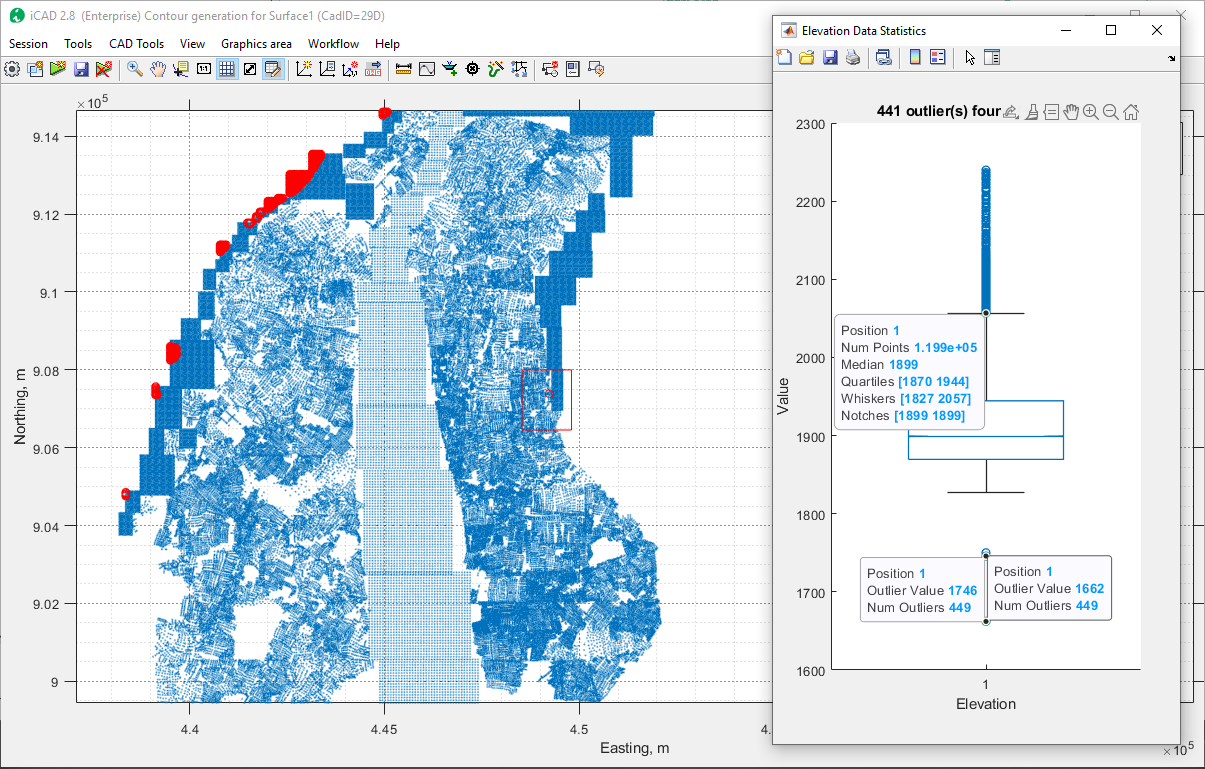
Where outliers are detected, the outlier points are also marked on the main interface with red circles. Right-Click on any outlier, and the context menu offers an option to remove the outlier.
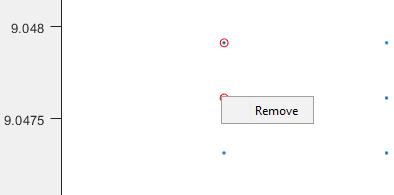
:warning: Important Note: The data is removed from the workspace. Save the session, to make sure the data is removed from the session data.
Note also that this will not remove data points from the source object.
To make sure the data from the host object is also clean, filter the data as outliened above to the bounding area containing all data points, and host it again to the source object.
Generating Contours
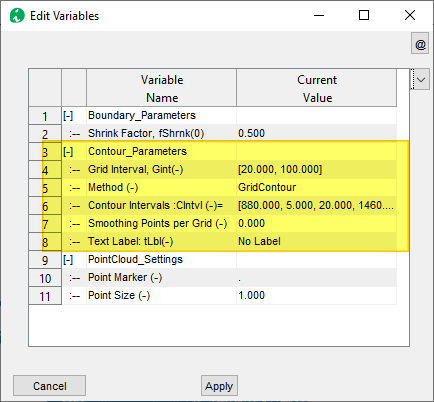
Contours can be generated using different specifications. These are found in the variables editor under the Contour Parameters group.
 {br}
{br}
- Grid Intervals: Higher and lower ordeer grid intervals for calculating a regularly spaced mesh data for input to contour generation. The most important parameter is the lower value. For most uses, 20 is a good value.
- Method: Specifies the method for grid data creation method. The options available are
- GridContour (default)
- gridFit (usually faster and robust - under development)
- Contour Intervals: The values of contour levels to generate, specifying the contolr elements desired. There are two common methods:
-
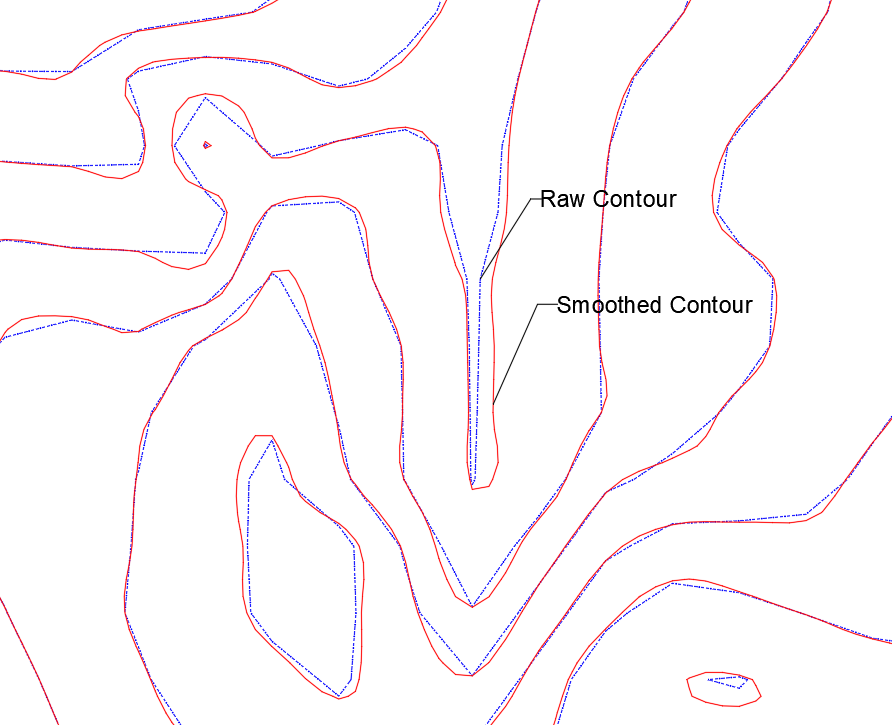
- Smoothing Points per Grid: This value is by default 0, indicating no smoothing applied. Input an integer value between 1 and 4 to smoothen the contours. Each grid cell is subdivided in to smaller regions based on this setting, and cubic interpolation is applied on the grid data, resulting in a more smoother contour.
-
Text Label: Show sparse or dense contour labels along the generated contours.
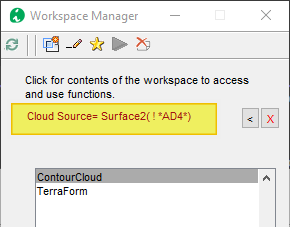
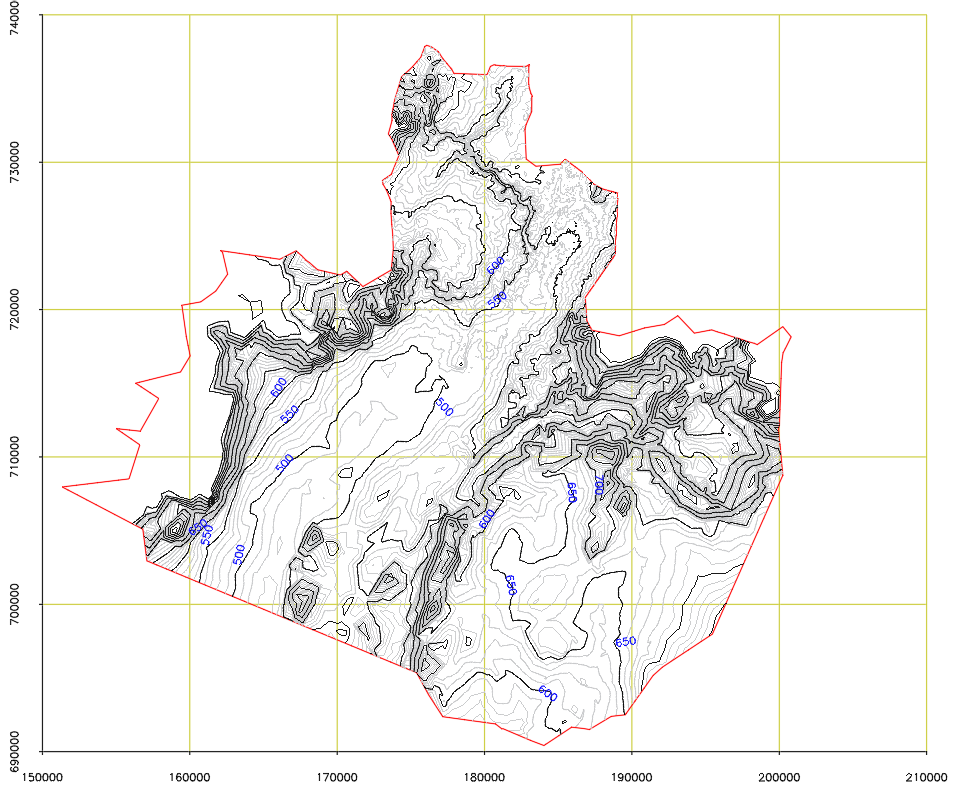
Important Note: If a surface data is loaded in to the iCAD workspace (see image below), this overrides the use of the specified methods and implements the interpolant generated from the surface data.
Once the settings for the session are all assigned, contours are generated using Workflow > Create Contours menu command.
The interval for generating contours can be controlled from Workflow > Edit Variables menu command. One can also specify if contour lables are needed, and how dense they should be.
:bulb: Tip: For computational efficiency, boundary and grid data are calculated once and stored. This may some times cause contour plots to NOT respond to new boundary areas created. If this happens, use
Workflow > Clear Calcualted Dataand run again.
The following image shows contours generated for the same data, with and with out smooting. Smoothing gives a more presentable result, as can be seen in parts of the contour area.
 {br}
{br}
Note: It is important to keep in mind that smoothed out contours are second level interpolations and DO NOT accurately represent surface variation. They are also not used in subsequent analysis in any way in iCAD and related products.
Generated AutoCAD Plots
Contour plots and boundary data can be easily plotted to AutoCAD environment. FOllow below steps:
-
Start the
Workflow > Select Draw to AutoCADmenu command.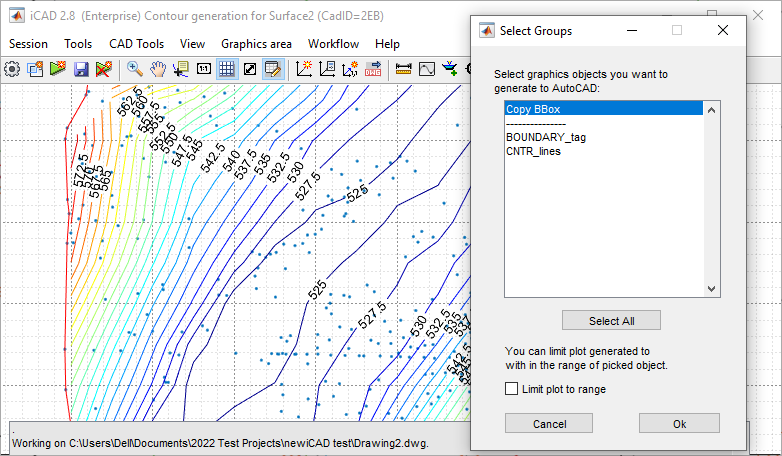
-
From the Select Groups dialog, select the objects to draw to AutoCAD. You can choose Contours, Boundy or both. Then follow the prompts.
Note that, Contours are created as groups.
-
Once in AutoCAD environment, you can label contoures as follows. Start the AutoCAD addon tool as shown below.

-
When prompted, pick a sample text. The Height of the sample text selected will be used to generate the contour labels. Note, the text style used will be the current style of AutoCAD. Simply hit ENTER to input a desired text height.
- When prompted, pick all the contour line objects you want to label. Right Click when done.
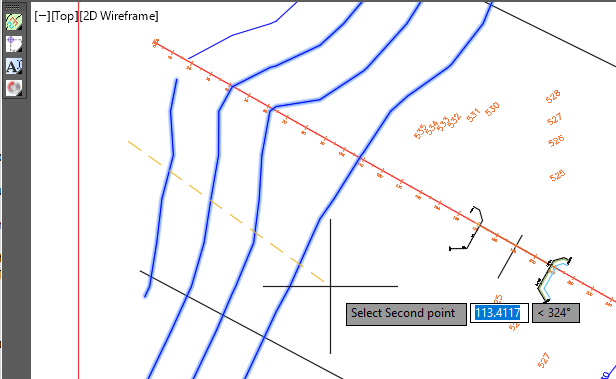
-
You will be prompted to draw a crossing line along the locations where you want contour labels. Pick a starting and ending ponts.
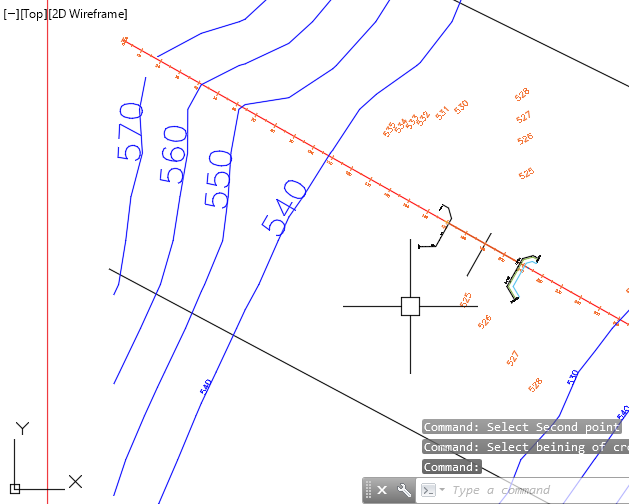
-
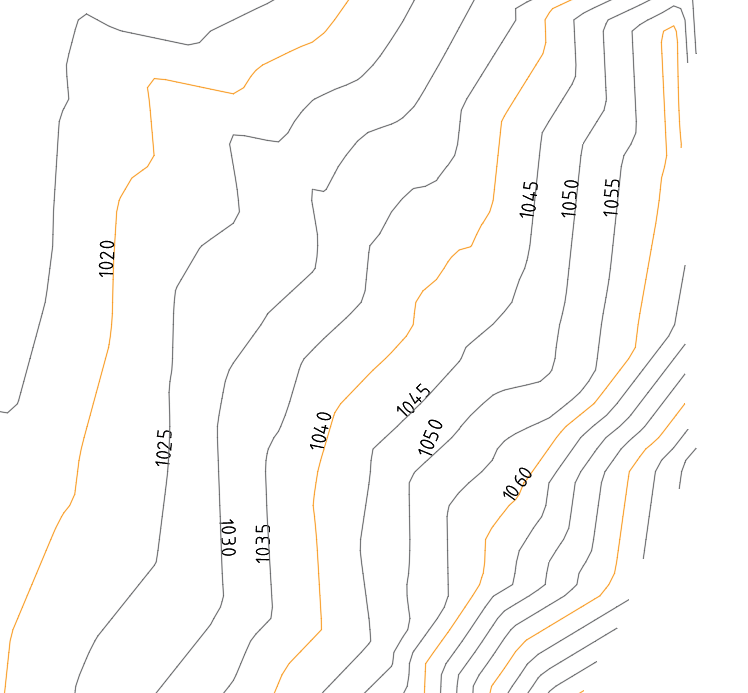
The contour labels will be generated as shown below.
- Repeat from step 5 to continue generating more labels, or hit Enter key to finish.
For more information on generating drawings to AutoCAD see the Data Processing and Presetation Section.
:bulb: Tip: Controus are generated to AutoCAD with contour label information, and at the elevation matching the contour level. Use the AutoCAD Addon tools to create the labels.
Working with large data sets
Note: Below tips apply to older versions (before Jul 2024), and may not be needed in recent versions. Algorithms and workflows have been optimized.
When working with larger data sets, contour generation to AutoCAD can take some time. The following workaround may help save some time, in such cases. Assuming the user needs a contour plot of 1.0 unit interval:
First, generate the contours with out the need for labeling, i.e., every 1unit interval, and export using Render to File option. This process should complete much faster.
Finally, generate the contours that require labeling, such as major contour lines at 5m intervals, and generate directly (with out the render to file option). This may take a while, but because the contour lines are much smaller in number, there is a timve saving.
END.