iCADdocs_online
Digital Chart or Graph Reader
ChartView module can quickly digitize charts and read values at desired locations, increasing accuracy and reducing time. Using the tool is intutive. It requires that the source image be orthogonal (i.e., perpendicular abscisa and ordinate axis), and both are at their natural orientation (i.e., abscisa is horizontal, and ordinate is vertical).
Table of Contents
Seting up and reading charts
To use this module, you will need the image of the chart or graph to read ready in a file or open in some application on the computer. Then follow these steps.
-
Define the session, as you would normally do with any session. Use the standard ChartView host object provided from
Tools > Create Host Objects. The first time it opens, it displays an empty axis, or blank screen. That is ok. -
Load the image from
Workflow > Load Image....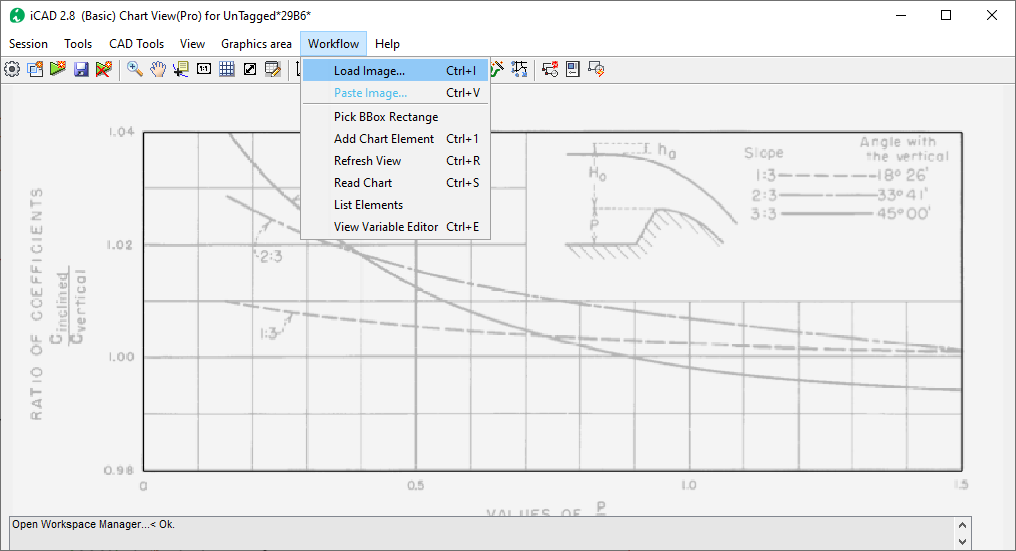
:bulb: Tip: Control the visibility of the image (its transparency) from the
Workflow > Variable Editorby changing Transparency Value as desired. -
Create the reference frame for the data set from
Workflow > Pick BBox Rectangle. On the image, **click and drag ** from he left-bottom corner of the image to the top-right corner of the image. Start and finish accurately on the limits of the graph area. This will determine the accuracy of the chart reading process later. -
Go to
Workflow > Variable Editorand set the data range. Also, specify the scaling for each axis, i.e., whether linear or log.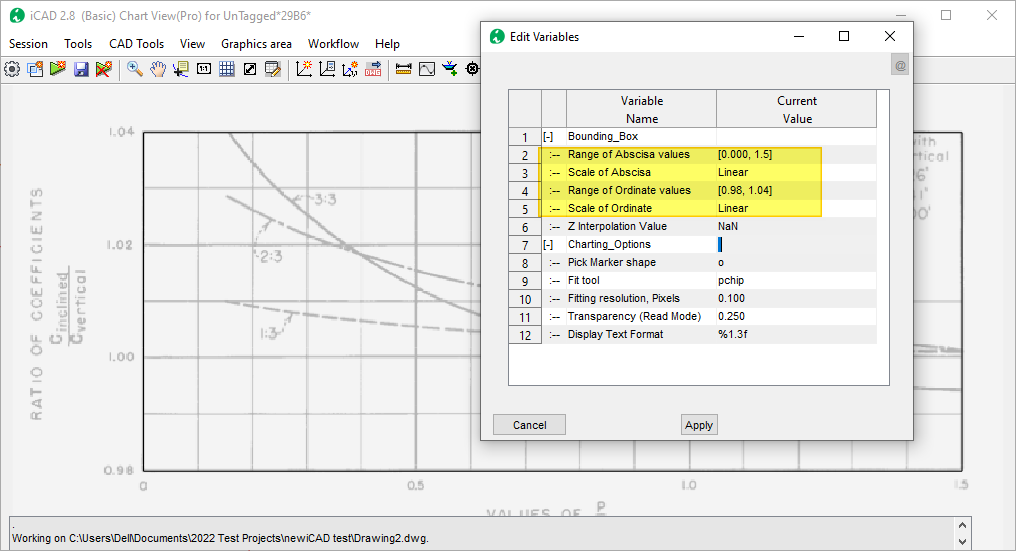
-
Now create the data points. Go to
Workflow > Add Chart Element. The interface will be in select mode, with a big cross-hair. Pick points along the graph representing the line to digitize, and useRight-Clickto finish input.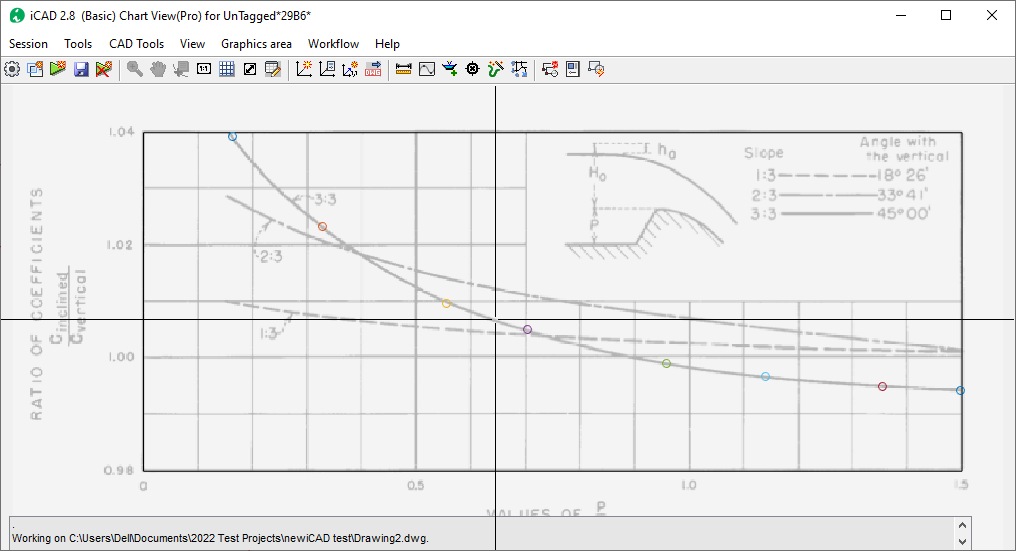
The digital copy of the curve line is created using curvilinear interpolation for the data range defined earlier.
- Edit selection points as needed.
-
To remove a point,
Right-clickon it, and choose Remove Point.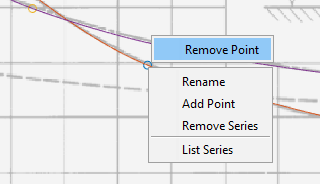
-
To add a point,
Right-click' on the line (NOT a Point). Use the context menuAdd Point`.
-
-
Read the graph element from
Workflow > Read Chart. This will start the reader, with a vertical red line some where at the center. Click on it, and move the mouse to a desired location. The values are interactively displayed for the current location.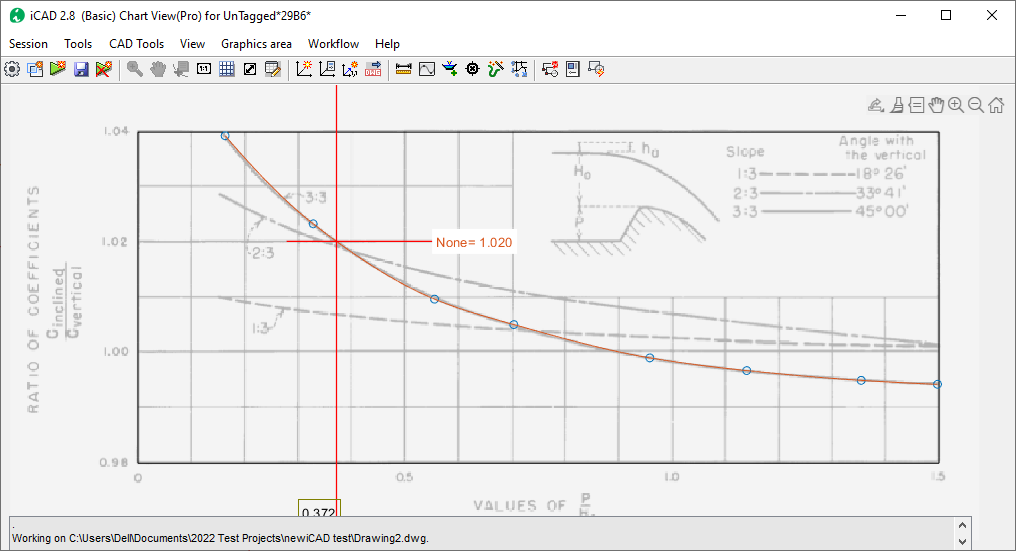
Use the
esckey to stop interactive reading.:bulb: Tip As many chart elements as needed can be digitized in this way, and saved for latter use.
- Save the work if desired.
Interpolated reading
The chart reader can interpolate and display values for paramters whose chart if not available. For instance in the current exaple, values are only available for parameters of 1:3, 2: 3 and 3: 3. Interplated reading comes in handy when the user needs values for, say, 1:2.5.
To achieve this, follow below steps.
-
Create the lower and upper bounding charts for the desired value following the above listed steps. For this example, we will need the curves for 3:3 and 2:3.
-
Name the chart elements by right-clicking on each char line, and choosing
Rename. For each input the name as z3 and z2.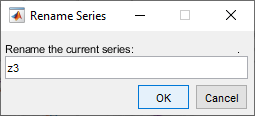
-
Test the input values, by reading the chart from
Workflow > Read Chart. Make any edits or adjustments needed to get correct results.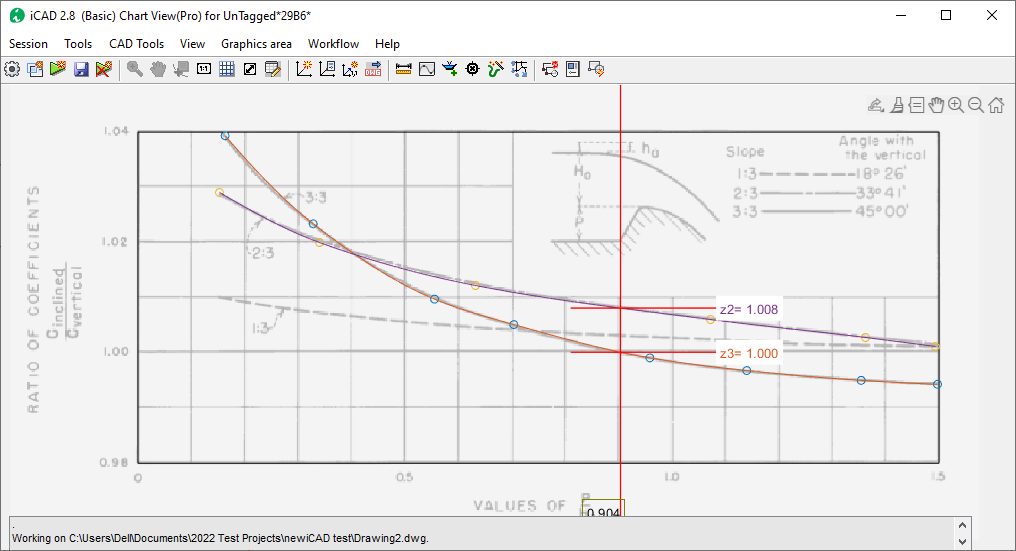
-
Go to
Workflow > Variable Editorand edit the Z Interpolation Value parameter. Input 2.5, the desired parameter value needed.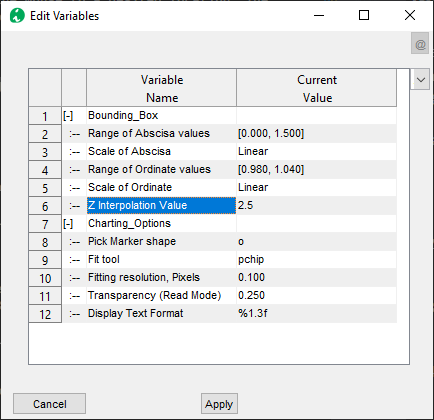
-
Now, start the reader from
Workflow > Read Chart, and hover arround. The values are interpolated for the desired value and displayed.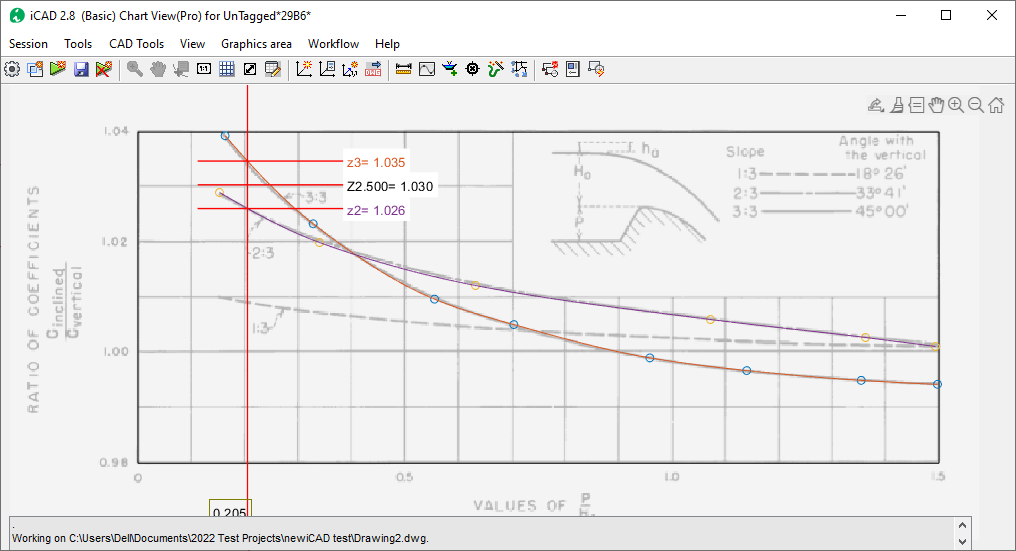
:notebook: Note: If more than two series data are found, then the interpolation method used to calcualte the new value will use that specified in the Variable Editor.
Exporting Data
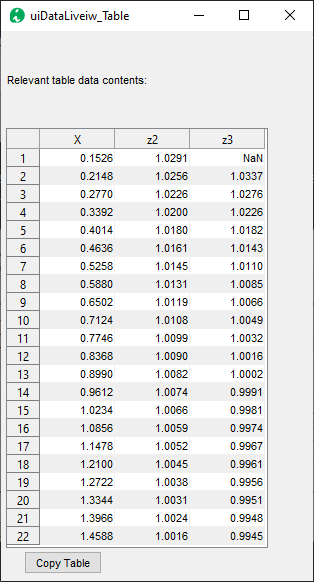
If desired, the digitized data points can be exported to the windows clipboard as a list. Right-Click on any one of the chart elements created, and choose List Series.
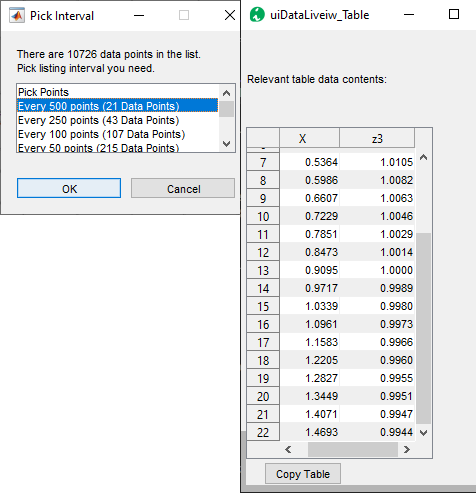
Choose desired resolution from the dialog. The data is displayed on the data table viewer interface.
If a list of all chart elements is desired, use the Workflow > List Elements menu command, and choose the desired resolution. The data is displayed as needed.
END.